

If you have already worked through our one-way ANOVA case study, you know how to compare three or more groups on one outcome. But real dissertations are rarely that simple. What if you want to compare groups and check whether something else — like year of study, or gender — changes the picture?
That is exactly what a two-way ANOVA in SPSS does. It tests two grouping variables at once, and — this is the part students find most valuable — it tells you whether those two variables interact: whether the effect of one depends on the level of the other.
In this case study we run a complete two-way ANOVA together, slowly: the setup, every click, every output table explained, the profile plot read properly, and a finished APA-style results paragraph at the end. Same calm format as before — one small step at a time.
In this guide
- What is a two-way ANOVA — and when do you use it?
- The case study: does study support work differently for different year groups?
- The three hypotheses (yes, there are three)
- Setting up your data
- Running the two-way ANOVA: Steps 1–6
- Reading the output: Steps 7–10
- The profile plot: seeing the interaction
- Effect sizes
- The APA-style write-up
- Common mistakes (and calm fixes)
- Quick questions, answered
What Is a Two-Way ANOVA (and When Do You Use It)?
A two-way ANOVA compares group means when you have two grouping variables (called factors) and one continuous outcome. Use it when:
- You have two factors — for example, teaching method (3 types) and year of study (Year 1 vs final year).
- You have one continuous outcome for everyone (an exam score, a scale total).
- Each person belongs to exactly one combination of the two factors.
It answers three questions at once:
- Main effect of Factor A — does the first factor matter, ignoring the second?
- Main effect of Factor B — does the second factor matter, ignoring the first?
- The interaction — does the effect of one factor depend on the other?
The interaction is the reason two-way ANOVA exists. Two separate one-way ANOVAs cannot find it — and in many dissertations, the interaction is the most interesting finding of all.
The Case Study: Does Study Support Work Differently by Year Group?
We continue the story from our one-way ANOVA post — the same fictional university, one term later.
A student researcher now asks a richer question: does the type of study support still matter — and does it matter differently for Year 1 students versus final-year students? Perhaps peer study groups help first-years settle in, while final-year students, with established networks, gain little from them.
120 students took part, 20 in each combination of the two factors:
- Factor A — Study support: No extra support · Peer study group · Tutor-led sessions
- Factor B — Year of study: Year 1 · Final year
At the end of term, everyone sat the same standardised test, scored out of 100.
Research questions: Does study support affect exam scores? Does year of study? And — the key one — does the effect of study support depend on year of study?
Why two-way ANOVA fits: one continuous outcome (exam score), two grouping variables, each student in exactly one of the six combinations. This is a 3 × 2 between-subjects design.
Practise along with us: download the practice dataset used here — download the free two-way ANOVA practice dataset (CSV) — and follow every step in your own SPSS. If your numbers match ours at the end, you have done it perfectly. (A teaching dataset created for this case study, so you can learn the method safely before touching your own data.)
The Three Hypotheses
A two-way ANOVA tests three pairs of hypotheses — one per effect:
- Main effect of support: H0 — no difference in mean scores between the three support types. H1 — a difference exists somewhere between them.
- Main effect of year: H0 — no difference in mean scores between Year 1 and final-year students. H1 — a difference exists.
- Interaction: H0 — the effect of study support is the same for both year groups. H1 — the effect of study support differs between year groups.
Examiners love the interaction hypothesis, because it shows you understand that real life is rarely “one factor, one answer”.
Before You Run Anything: Setting Up the Data
Your SPSS file needs three variables — two grouping, one outcome:
| Variable | Type | Measure | What to set |
|---|---|---|---|
| Support | Numeric | Nominal | Value labels: 1 = No extra support, 2 = Peer study group, 3 = Tutor-led sessions |
| Year | Numeric | Nominal | Value labels: 1 = Year 1, 2 = Final year |
| Score | Numeric | Scale | The test score out of 100 |
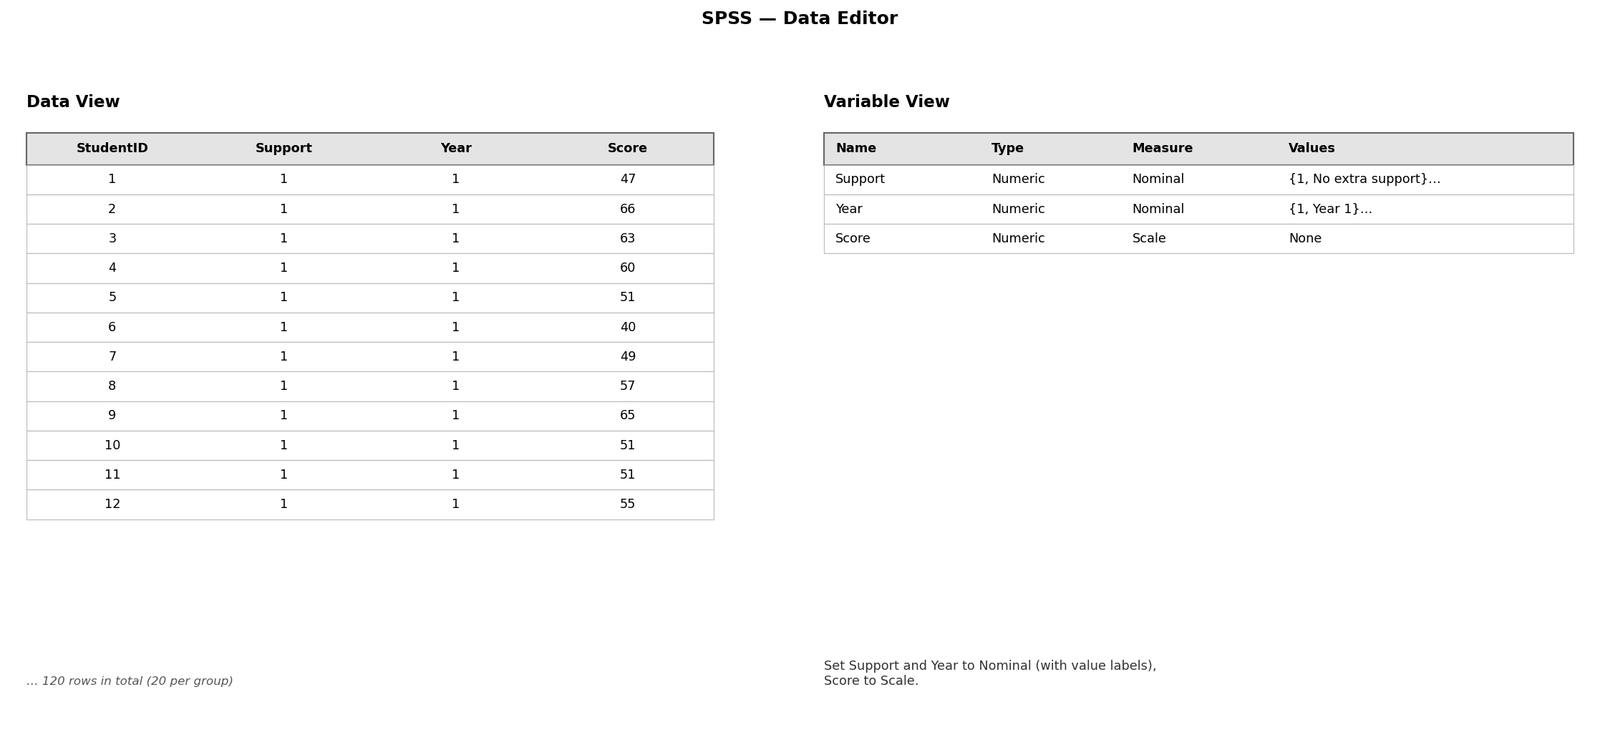
One row per student: two codes and a score. Before testing, run the same two sanity checks as ever — Frequencies on Support and Year (20 students in each of the six combinations, 120 in total) and Descriptives on Score to catch impossible values. Calm data in, calm results out.
Step by Step: Running the Two-Way ANOVA in SPSS
Two-way ANOVA lives in a different SPSS menu from one-way ANOVA — this is the step where most students get lost, so follow it exactly.
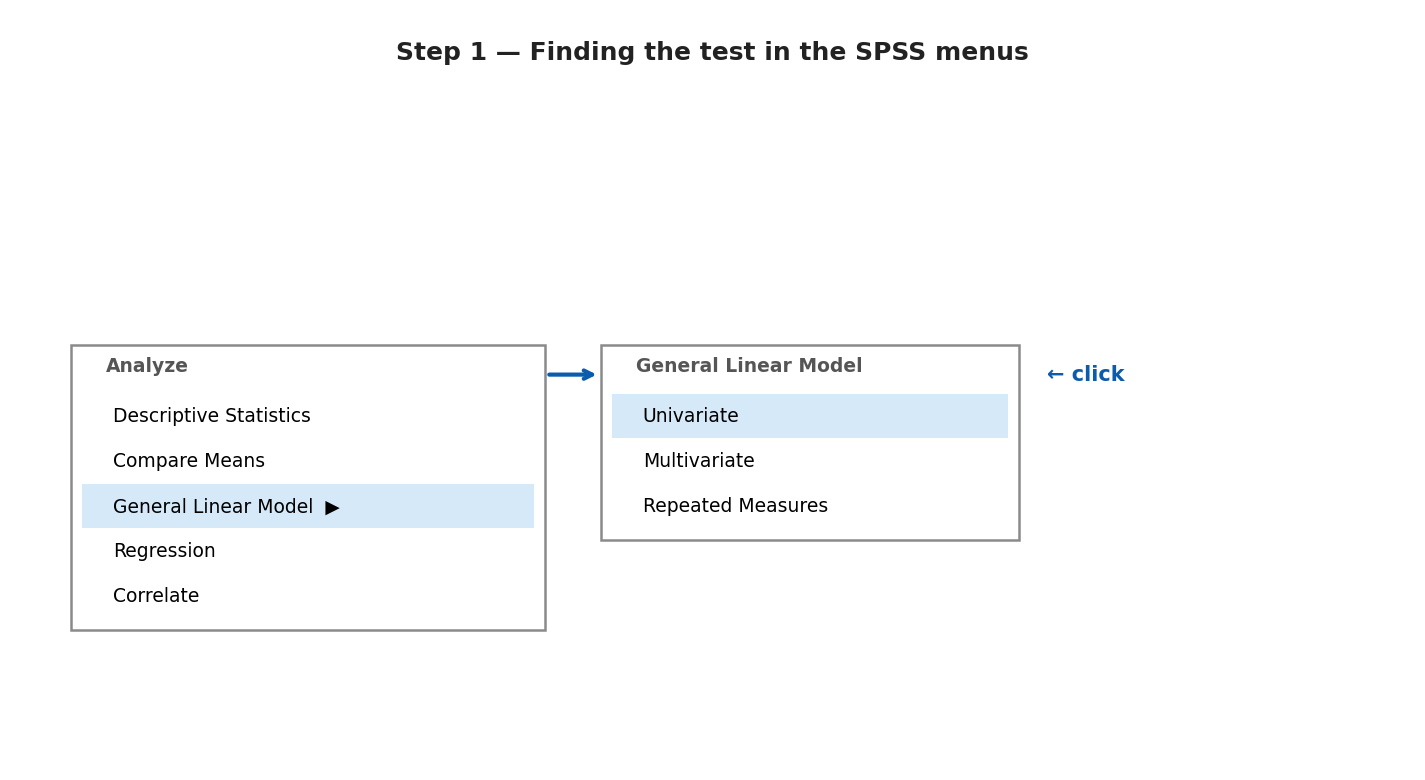
Step 1 — Open the test
Click Analyze → General Linear Model → Univariate… A dialogue box opens. (Yes — “Univariate” is SPSS’s name for this test. Your data is safe; nothing changes until you click OK.)
Step 2 — Assign your variables
Move Score into the Dependent Variable box. Move Support and Year into the Fixed Factor(s) box. The rule from last time still holds: the factors are what sort students into groups; the dependent variable is what you measured.

Step 3 — Ask for the profile plot
Click Plots… Move Support into the Horizontal Axis box and Year into the Separate Lines box, then click Add and Continue. This plot is how you will see the interaction — it is worth the ten seconds.

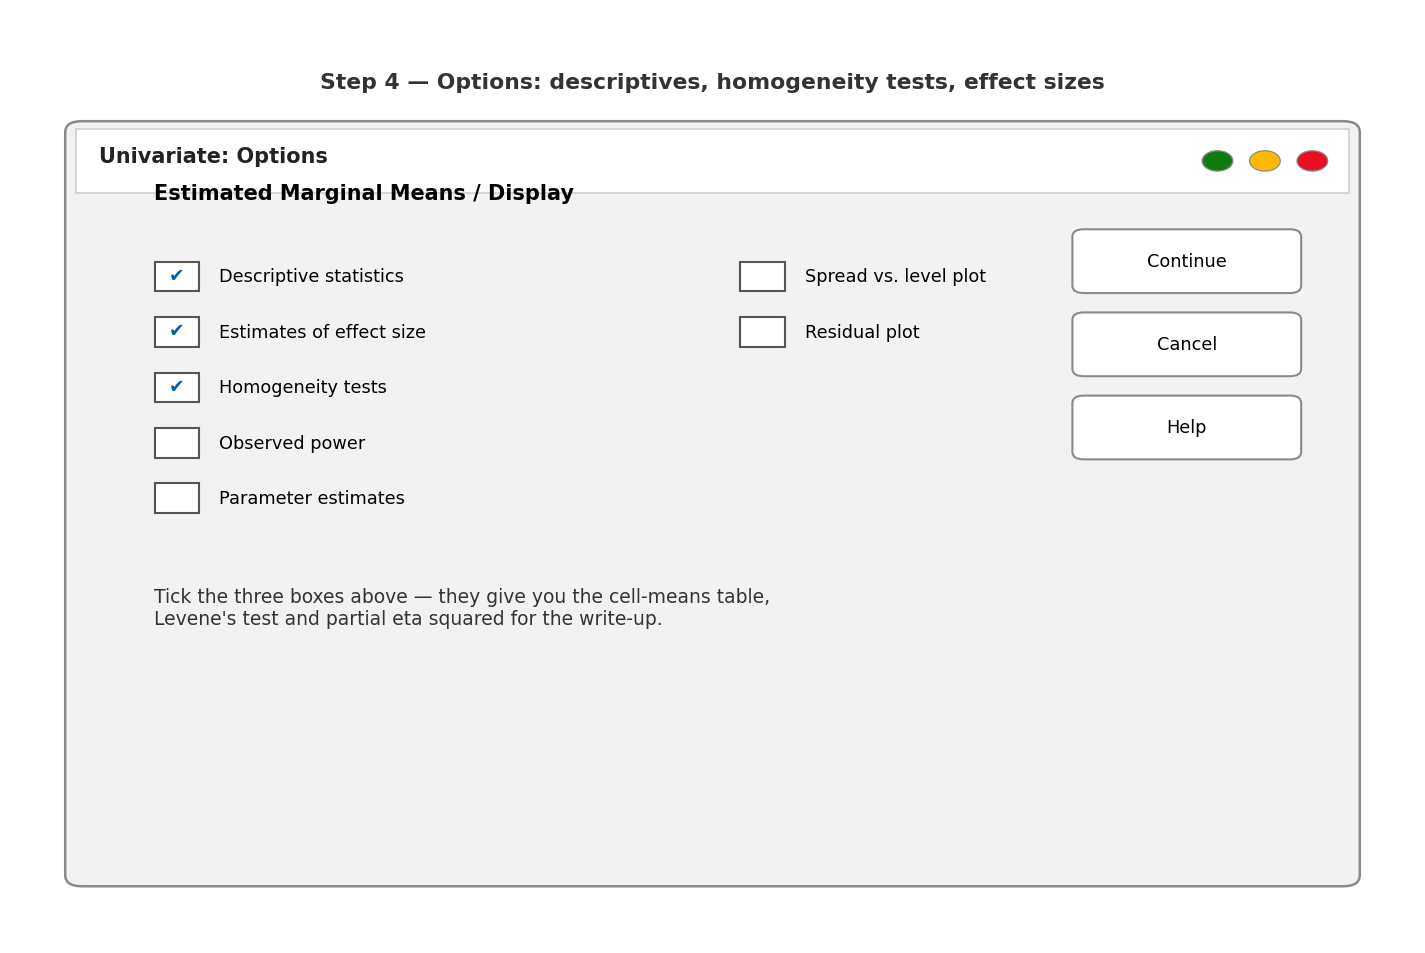
Step 4 — Ask for descriptives, the variance check, and effect sizes
Click Options… and tick Descriptive statistics, Homogeneity tests, and Estimates of effect size. Then Continue. These give you the cell-means table, Levene’s test, and partial eta squared — everything the write-up needs.
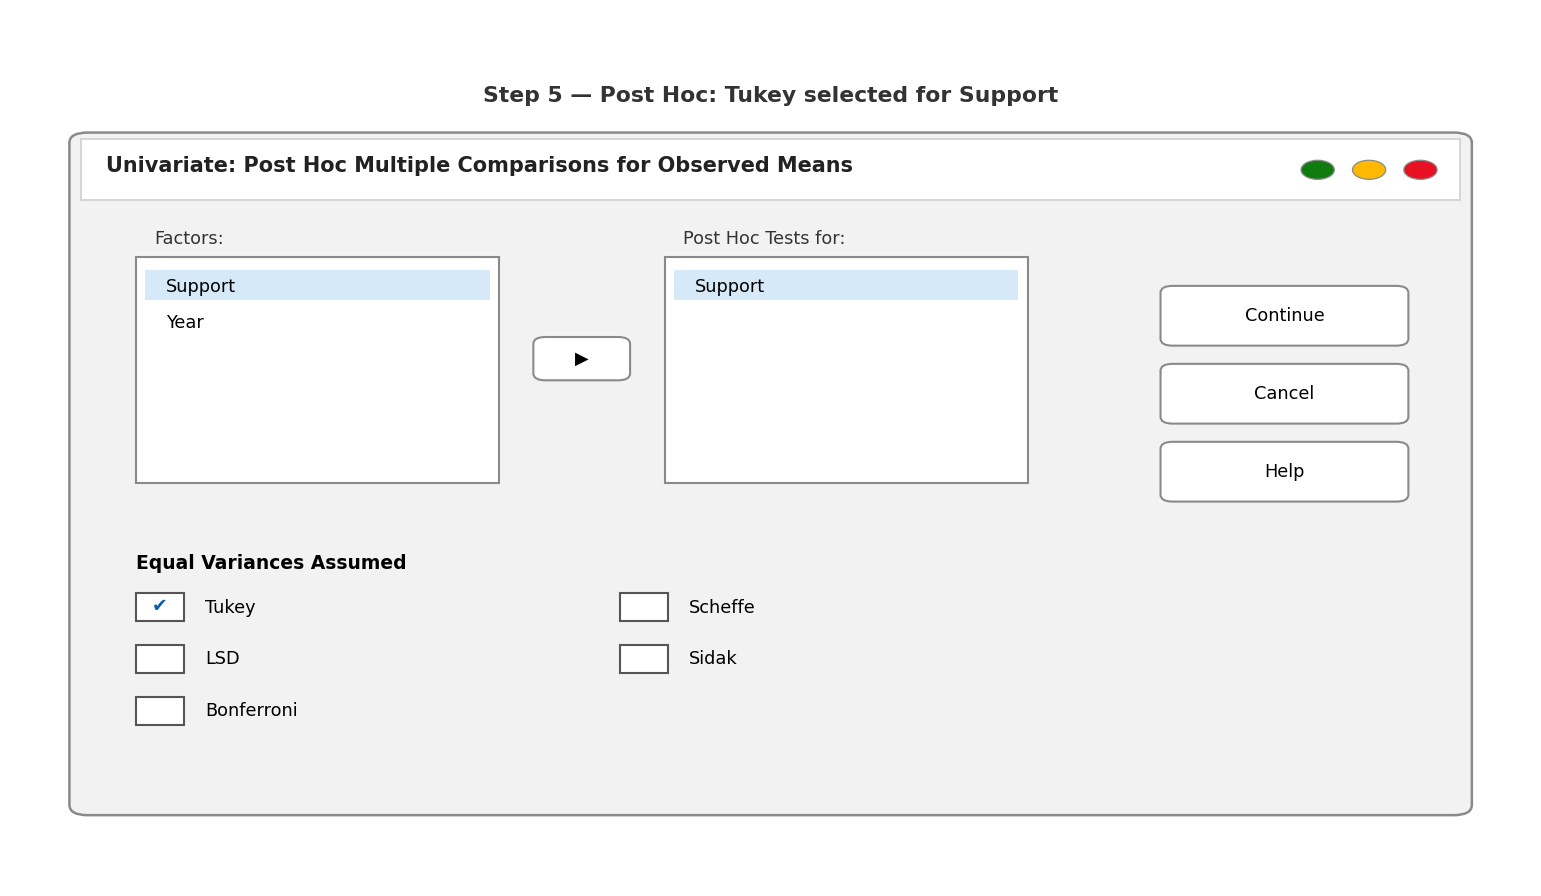
Step 5 — Choose the post-hoc test
Click Post Hoc…, move Support into the right-hand box, and tick Tukey. Then Continue. (Year has only two levels, so it needs no post-hoc test — with two groups, the main effect already tells you which is higher.)
Step 6 — Run it
Click OK. The Output window opens. Remember: running an analysis never changes your data — re-run it as often as you like. Now let’s read each table in order.
Reading the Output, Table by Table
Step 7 — The Descriptives Table: Meet Your Six Groups
Always start with the means, before any p-value. With 20 students per cell:
Table 1. Descriptive statistics — Exam score by support type and year
| Support | Year | N | Mean | SD |
|---|---|---|---|---|
| No extra support | Year 1 | 20 | 55.15 | 7.10 |
| No extra support | Final year | 20 | 60.70 | 6.76 |
| Peer study group | Year 1 | 20 | 68.10 | 7.40 |
| Peer study group | Final year | 20 | 62.50 | 7.04 |
| Tutor-led sessions | Year 1 | 20 | 68.25 | 6.64 |
| Tutor-led sessions | Final year | 20 | 72.95 | 6.95 |
Read it like a story: for Year 1 students, both peer groups (68.10) and tutor-led sessions (68.25) sit far above no support (55.15). For final-year students, tutor-led (72.95) leads clearly, while peer groups (62.50) barely beat no support (60.70). The peer-group effect looks different across the two years — that suspicion is what the interaction test will confirm or deny.
Step 8 — Levene’s Test: Checking the Variances Assumption
A two-way ANOVA assumes roughly equal variances across all six groups. Levene’s test checks this for you.
Table 2. Levene’s Test of Equality of Error Variances
| F | df1 | df2 | Sig. (p) |
|---|---|---|---|
| 0.32 | 5 | 114 | .902 |
As before, a non-significant result is what you want: p = .902, well above .05, so the assumption is met and you can trust the ANOVA table that follows.
Step 9 — The ANOVA Table: Three Answers at Once
In a two-way ANOVA this table is called Tests of Between-Subjects Effects. Read the three rows marked with your factors.
Table 3. Tests of Between-Subjects Effects — Exam score
| Source | df | F | Sig. (p) | Partial η² |
|---|---|---|---|---|
| Support | 2 | 33.22 | < .001 | .37 |
| Year | 1 | 1.48 | .227 | .01 |
| Support × Year | 2 | 7.90 | < .001 | .12 |
| Error | 114 |
Three answers, one table:
- Support: F(2, 114) = 33.22, p < .001 — a significant main effect. Study support type matters. (The Tukey post-hoc, which you asked for in Step 5, shows tutor-led and peer groups both scored above no support — same reading skills as last time.)
- Year: F(1, 114) = 1.48, p = .227 — not significant. Overall, Year 1 and final-year students did not reliably differ. On its own this looks like a dead end.
- Support × Year: F(2, 114) = 7.90, p < .001 — a significant interaction. The effect of study support depends on year of study.
Now the golden rule of two-way ANOVA: when the interaction is significant, it qualifies the main effects. The headline is no longer “support matters” — it is “how support matters depends on year group”. That is a deeper, more dissertation-worthy finding, and it is exactly why you ran this test instead of two one-way ANOVAs.
Step 10 — The Profile Plot: Seeing the Interaction
Open the profile plot you requested in Step 3. You will see two lines — one per year group — tracing mean scores across the three support types.
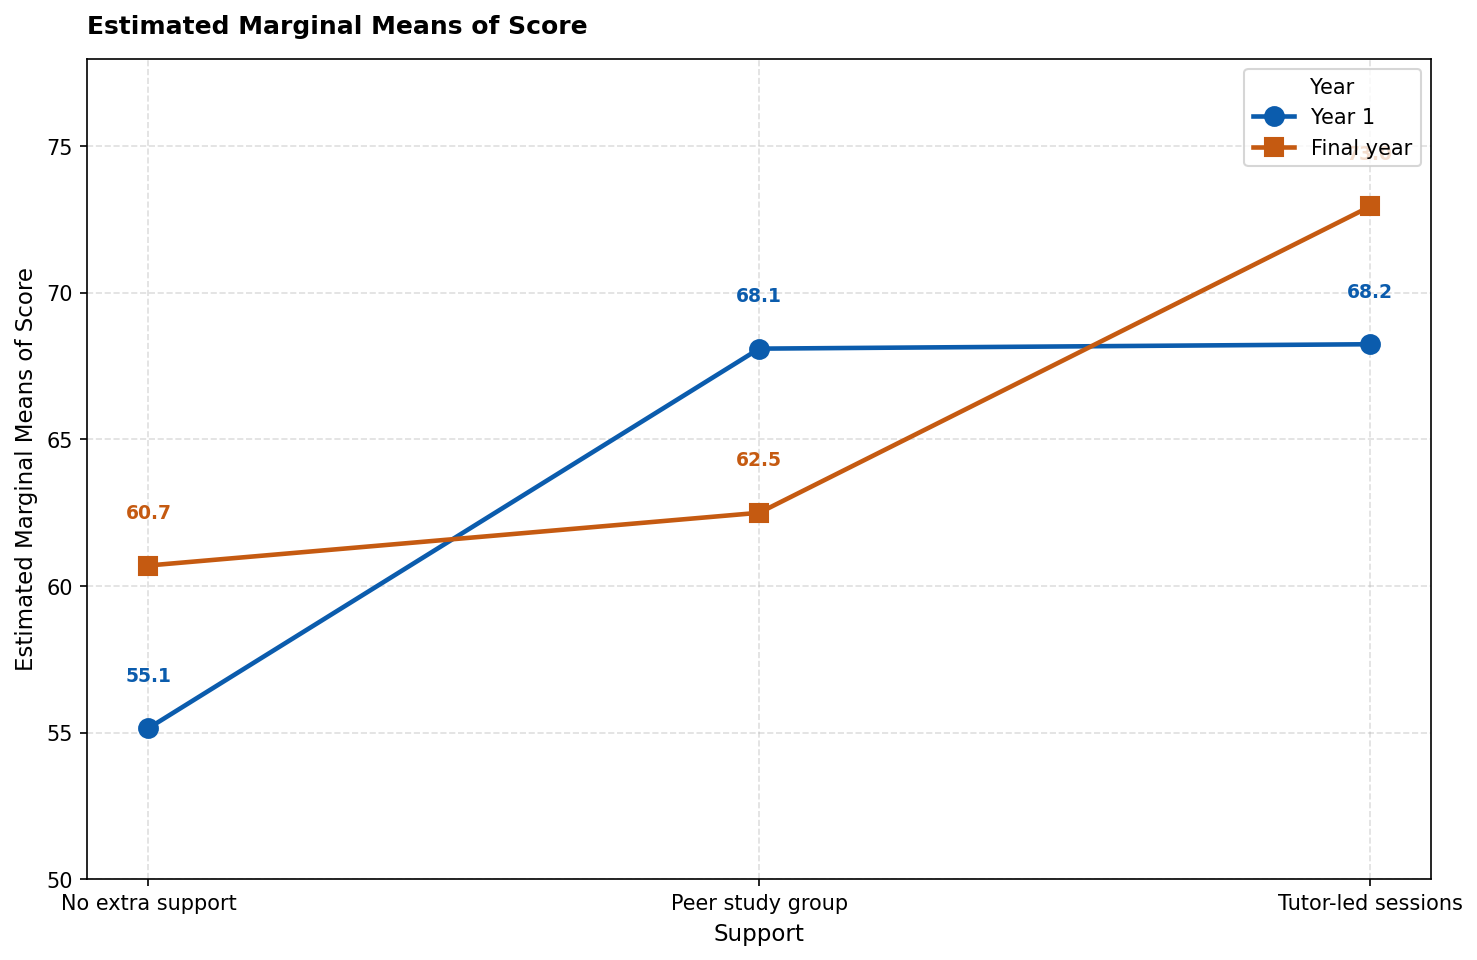
If there were no interaction, the two lines would run roughly parallel. Here they do not: the Year 1 line jumps steeply from no support up to peer groups, then flattens; the final-year line rises gently to peer groups, then climbs again to tutor-led. Non-parallel lines are the visual signature of an interaction.
Describe the pattern in plain words — this is what your discussion chapter needs:
- Year 1 students: peer groups lifted scores by about 13 marks (55.15 → 68.10) — nearly as much as tutor-led sessions (68.25).
- Final-year students: peer groups barely moved the needle (60.70 → 62.50), while tutor-led sessions added about 12 marks (→ 72.95).
One calm sentence captures it: peer study groups helped Year 1 students far more than final-year students, while tutor-led sessions helped everyone. That single sentence is the interaction, translated into English.
Effect Sizes: How Big Are These Effects?
SPSS printed partial eta squared because you ticked it in Step 4 — the proportion of variation each effect explains, after accounting for the others:
- Support: partial η² = .37 — a large effect.
- Support × Year interaction: partial η² = .12 — a medium-to-large effect, and the one your discussion should linger on.
- Year: partial η² = .01 — negligible, matching its non-significant p-value.
(Usual benchmarks: .01 = small, .06 = medium, .14 = large. Report the effect size even when p is not significant — it stops you mistaking “not significant” for “no effect at all”.)
Writing It Up: The APA-Style Results Paragraph
Here is the complete analysis as a finished results paragraph, using the real values from the tables above:
A 3 × 2 between-subjects ANOVA was conducted to examine the effects of study support (no extra support, peer study group, tutor-led sessions) and year of study (Year 1, final year) on exam scores. Levene’s test indicated that the assumption of equal variances was met, F(5, 114) = 0.32, p = .902. There was a significant main effect of study support, F(2, 114) = 33.22, p < .001, partial η² = .37. The main effect of year of study was not significant, F(1, 114) = 1.48, p = .227, partial η² = .01. These effects were qualified by a significant support × year interaction, F(2, 114) = 7.90, p < .001, partial η² = .12. Peer study groups were associated with substantially higher scores among Year 1 students (M = 68.10, SD = 7.40) than no support (M = 55.15, SD = 7.10), but made little difference for final-year students (M = 62.50, SD = 7.04 vs. M = 60.70, SD = 6.76). Tutor-led sessions were associated with the highest scores in both year groups.
Notice the structure: assumption check first, then each effect with F, df, p and effect size together, then the interaction unpacked in plain words with the actual means. Copy that skeleton for your own analysis and you will rarely go wrong.
Reading along nicely? If choosing the right test is still the uncertain part, our free workbook — SPSS Dissertation Workbook: Which Test Should You Use? — walks you through the choice in a few gentle questions. Get the free workbook. And if your own two-way ANOVA output looks different from this one, message us on WhatsApp — tap the icon, tell us where you got stuck, and we will help you find your next step, calmly. No pressure, ever.
Common Mistakes (and the Calm Fix for Each)
- Running two one-way ANOVAs instead of one two-way ANOVA. Two separate tests cannot detect an interaction — and each extra test inflates the chance of a false finding. One two-way ANOVA is cleaner and more honest.
- Interpreting main effects while ignoring a significant interaction. If the interaction is significant, describe the pattern cell by cell (as above). Reporting only “support was significant” buries your best finding.
- Putting both factors in as covariates. In the Univariate dialogue, factors go in Fixed Factor(s) — Covariate(s) is for continuous control variables (that is ANCOVA, a future case study).
- Requesting post-hoc tests for a two-level factor. Year has two levels — the main effect already tells you which is higher. Post-hoc tests are only for factors with three or more levels.
- Reading the profile plot backwards. Non-parallel lines mean interaction; parallel lines mean the factors act independently. If in doubt, describe what you see in one plain sentence before worrying about the statistics.
- Forgetting value labels. “1 vs 2” in an output table means nothing to a reader — or to you, three weeks later. Label every level before you run anything.
You have just worked through a complete two-way ANOVA — well done.
If choosing the right test is the part you still feel unsure about, take our free workbook: SPSS Dissertation Workbook — Which Test Should You Use? It walks you through the choice in a few simple questions.
Prefer something printable? Our Etsy shop has thesis planners and SPSS checklists made for dissertation students.
Also from us: Confident Viva — calm, practical viva preparation for PhD and Masters students.
And if you are working with your own data and would like a second pair of eyes, message us on WhatsApp — tap the icon, tell us where you got stuck, and we will help you find your next step, calmly. No pressure, ever.
Stuck on a step, or did your output look different? Ask in the comments below — we read and reply to every student’s question.
Frequently Asked Questions
A one-way ANOVA tests one grouping variable; a two-way ANOVA tests two at once, plus their interaction — whether the effect of one depends on the other. If your research question names two groupings (e.g. teaching method and year group), you need the two-way version. Our one-way ANOVA case study covers the simpler design first.
Not at all — a non-significant interaction is a clean, reportable finding: it means the first factor’s effect is consistent across the second factor’s levels. Report it in one sentence and interpret your main effects normally. Not every dataset has an interaction, and examiners respect an honest null result.
For any factor with three or more levels that has a significant main effect, yes — Tukey, exactly as in Step 5. And when the interaction is significant, the most informative follow-up is comparing cell means within the interaction (SPSS: EM Means → compare main effects, or simple-effects tests) — that is how you earn statements like “peer groups helped Year 1 students but not final-year students”.
Partial eta squared (partial η²), which SPSS prints when you tick Estimates of effect size in Options. It is the standard choice for factorial ANOVA in APA style — note it is not the same as the eta squared from a one-way ANOVA, so label it correctly.
Yes — three-way ANOVA exists (Analyze → General Linear Model → Univariate handles it), but interactions between three factors are genuinely hard to interpret and harder to explain to an examiner. Two factors cover the vast majority of dissertations. Master this first.
Keep learning — students also read
- SPSS Help & Case Studies Hub — every guide, one calm place
- Free Workbook: Which Test Should You Use? — choose your test in minutes
- One-Way ANOVA in SPSS — the first case study in this series
← Previous in this series: How to Run a One-Way ANOVA in SPSS — Step-by-Step Case Study