
Our one-way ANOVA case study compared three groups at once. But many dissertations ask a simpler question: do two groups differ? For that, you need the independent samples t-test — the gentlest inferential test in SPSS, and the perfect place to learn how hypothesis testing actually feels.
In this case study we run a complete t-test together: the setup, every click, every output table explained, the effect size, and a finished APA-style results paragraph. One small step at a time.
In this guide
- What an independent samples t-test is — and when to use it
- The case study: do interactive workshops lift exam scores?
- The hypotheses (just one pair this time)
- Setting up your data
- Running the t-test: Steps 1–4
- Reading the output: Steps 5–7
- The APA-style write-up
- Common mistakes (and calm fixes)
- Quick questions, answered
What Is an Independent Samples T-Test (and When Do You Use It)?
An independent samples t-test compares the means of two separate groups on one continuous outcome. Use it when:
- You have two groups — for example, a control group and a treatment group.
- The groups are independent: different people in each group.
- You measured one continuous outcome for everyone (a test score, a scale total).
Do not use it when the same people were measured twice (that is the paired samples t-test — coming soon in this series), or when you have three or more groups (that is one-way ANOVA).
The Case Study: Do Interactive Workshops Lift Exam Scores?
The same fictional university, a new question. A lecturer wonders whether interactive workshops produce better exam results than traditional lectures.
60 students were randomly assigned: 30 attended traditional lectures, 30 attended interactive workshops. Everyone sat the same final exam, scored out of 100.
Research question: is there a difference in mean exam scores between the two teaching methods?
Why the t-test fits: two independent groups, one continuous outcome. Nothing more complicated is needed — and that is the point.
Practise along with us: download the practice dataset used here — download the free independent t-test practice dataset (CSV) — and follow every step in your own SPSS.
The Hypotheses
One pair of hypotheses — refreshingly simple after ANOVA:
- H0 — there is no difference in mean exam scores between traditional lectures and interactive workshops.
- H1 — there is a difference in mean exam scores between the two methods.
Before You Run Anything: Setting Up the Data
Two variables — one grouping, one outcome:
| Variable | Type | Measure | What to set |
|---|---|---|---|
| Group | Numeric | Nominal | Value labels: 1 = Traditional lectures, 2 = Interactive workshops |
| Score | Numeric | Scale | The exam score out of 100 |
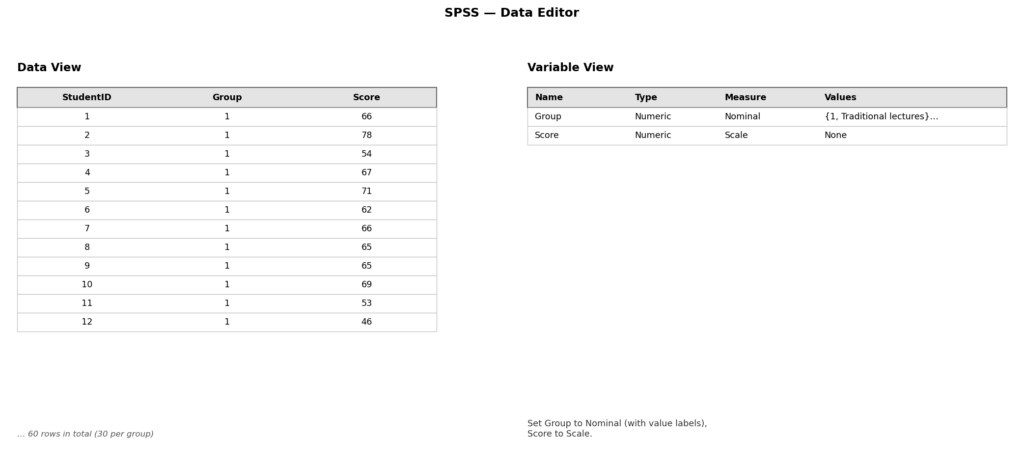
One row per student: a group code and a score. Run the usual sanity checks first — Frequencies on Group (30 and 30, 60 in total) and Descriptives on Score to catch impossible values.
Step by Step: Running the T-Test in SPSS
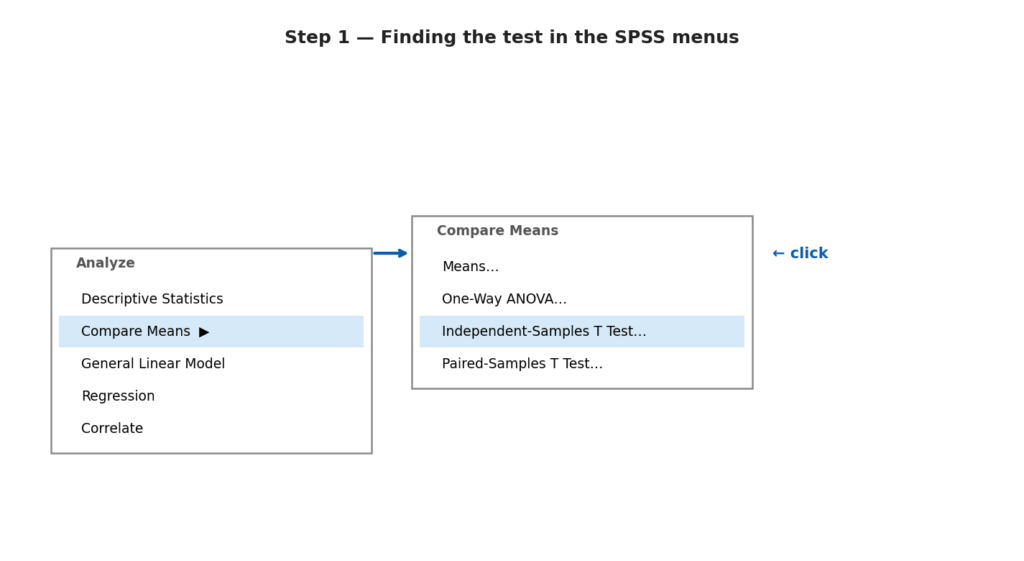
Step 1 — Open the test
Click Analyze → Compare Means → Independent-Samples T Test… A dialogue box opens.
Step 2 — Assign your variables
Move Score into the Test Variable(s) box. Move Group into the Grouping Variable box. Same rule as always: the grouping variable sorts students; the test variable is what you measured.

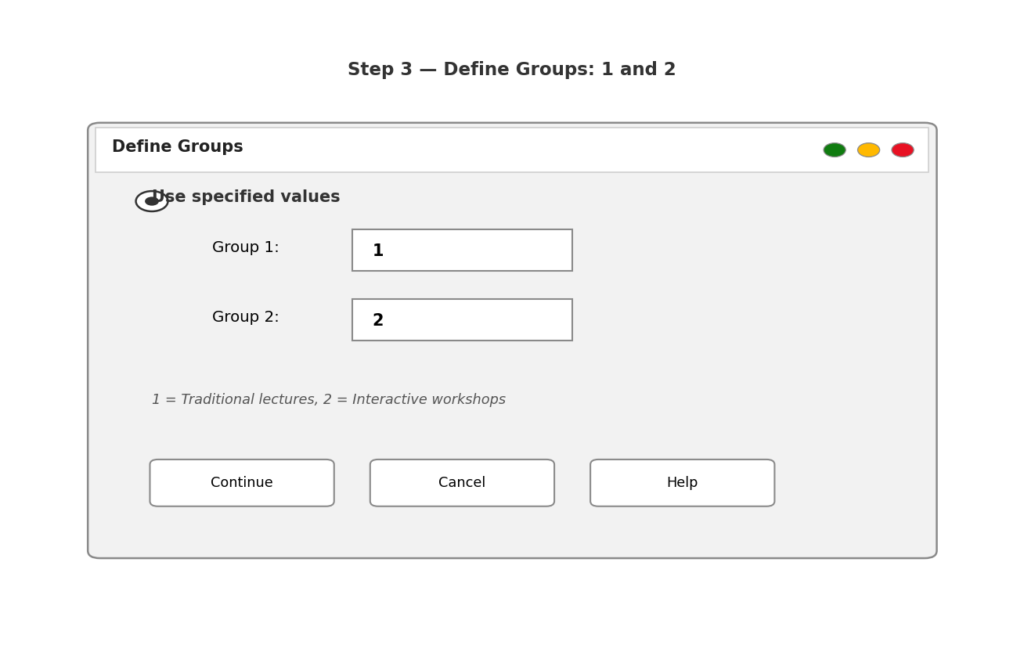
Step 3 — Define the groups
Click Define Groups…. Type 1 for Group 1 and 2 for Group 2 — matching the value labels you set — then Continue. This is the step everyone forgets once; now you will never forget it.
Step 4 — Run it
Click OK (the 95% confidence interval in Options is already correct — leave it). The Output window opens with just two tables. After ANOVA, this will feel like a holiday.
Reading the Output, Table by Table
Step 5 — Group Statistics: Meet Your Two Groups
Always start with the means, before any p-value:
Table 1. Group statistics — exam score by teaching method
| Group | N | Mean | SD |
|---|---|---|---|
| Traditional lectures | 30 | 63.90 | 7.86 |
| Interactive workshops | 30 | 68.33 | 6.64 |
The workshop group scored about 4.4 marks higher on average (68.33 vs 63.90). The question is whether a gap this size could plausibly be luck. The next table answers exactly that.
Step 6 — The T-Test Table: Levene’s Check, Then the Answer
This table is called Independent Samples Test. Read it left to right, in two halves.
Table 2. Independent samples test — exam score
| Levene’s F | Sig. (p) | t | df | Sig. (2-sided) | Mean difference | 95% CI | |
|---|---|---|---|---|---|---|---|
| Equal variances assumed | 0.42 | 0.521 | -2.36 | 58 | 0.022 | -4.43 | -8.19 to -0.67 |
First half — Levene’s test: F = 0.42, p = 0.521. Non-significant (above .05), so equal variances are assumed — read the top row, which is what the table above shows.
Second half — the t-test: t(58) = -2.36, p = 0.022. Significant (below .05). The 4.4-mark gap is not plausibly luck — interactive workshops genuinely lifted scores. The 95% confidence interval (-8.19 to -0.67) does not include zero, telling the same story in different words.
This is what the two tables look like in your SPSS Output window:

Step 7 — Effect Size: How Big Is the Difference?
SPSS can print Cohen’s d (tick Estimate effect sizes in Options). Here, d = 0.61 — a medium effect (benchmarks: 0.2 = small, 0.5 = medium, 0.8 = large). Significant and practically meaningful. Your discussion chapter wants this sentence.
Writing It Up: The APA-Style Results Paragraph
Here is the complete analysis as a finished results paragraph:
An independent-samples t-test was conducted to compare exam scores for students taught by traditional lectures and interactive workshops. Levene’s test indicated equal variances could be assumed, F = 0.42, p = 0.521. There was a significant difference in scores, t(58) = -2.36, p = 0.022, with students in interactive workshops scoring higher (M = 68.33, SD = 6.64) than students in traditional lectures (M = 63.90, SD = 7.86). The mean difference of 4.43 marks, 95% CI [-8.19, -0.67], represented a medium effect, Cohen’s d = 0.61.
Notice the skeleton you can reuse forever: assumption check, test statistic with df, p-value, group means, then the effect size in plain words.
So, What Does This Case Study Show?
Two lessons. First, the mechanics: the t-test is the simplest inferential test you will run — one dialogue box, two tables, one clear answer. Second, the mindset you will reuse in every harder test: means first, p-value second, effect size always. Master that order here and ANOVA, regression, everything after becomes calmer.
Ready for the next step? Our SPSS help and case studies hub collects every guide — including the one-way ANOVA and two-way ANOVA case studies for when you have more than two groups.
Common Mistakes (and the Calm Fix for Each)
- Forgetting Define Groups. The test will not run until you tell SPSS which codes are Group 1 and Group 2. Thirty seconds, Step 3.
- Using it on the same people twice. Before-and-after scores need the paired samples t-test, not this one — different test, different dialogue box.
- Reading the wrong Levene’s row. If Levene’s p is below .05, read the second row (equal variances not assumed). Here it was above .05, so the first row was correct.
- Reporting p without the means. “p < .001” alone says nothing about how much higher — always give both group means and the mean difference.
- Skipping the effect size. With 60 students, even a trivial gap can be “significant”. Cohen’s d tells you whether it matters.
Frequently Asked Questions
Independent compares two different groups of people (like here); paired compares the same people measured twice (before/after). Different designs, different SPSS dialogue boxes — check which one matches your data before clicking.
Not at all — just read the second row of the t-test table (“equal variances not assumed”). SPSS adjusts the degrees of freedom for you. Report that row and move on calmly.
Yes — the groups do not need equal numbers of people. The test handles it; just make sure each group is not tiny (roughly 20+ per group keeps things stable).
The moment you have three or more groups. Running three t-tests instead of one ANOVA inflates your chance of a false finding — our one-way ANOVA case study shows the right way.
With 30 people per group, the t-test is quite forgiving. With small or badly skewed samples, use the non-parametric alternative (Mann–Whitney U: Analyze → Nonparametric Tests) — coming soon in this series.
You have just run your first t-test — well done.
If choosing the right test is the part you still feel unsure about, take our free workbook: SPSS Dissertation Workbook — Which Test Should You Use? [Get the Free Workbook → /free-workbook/]
Prefer something printable? Our Etsy shop has thesis planners and SPSS checklists made for dissertation students.
Also from us: Confident Viva — calm, practical viva preparation for PhD and Masters students.
And if you are working with your own data and would like a second pair of eyes, message us on WhatsApp — tap the icon, tell us where you got stuck, and we will help you find your next step, calmly. No pressure, ever.
Stuck on a step, or did your output look different? Ask in the comments below — we read and reply to every student’s question.
← Previous in this series: How to Run a Two-Way ANOVA in SPSS — Step-by-Step Case Study